Business intelligence for all your needs
We cover every layer. Pulling together data from your business systems and turning it into reliable information, self-service dashboards allowing you to easily examine and understand that information, and Expert analysts to review the impact on your business
WHAT WE DO
Our Core Services
BI Dashboards & Reporting
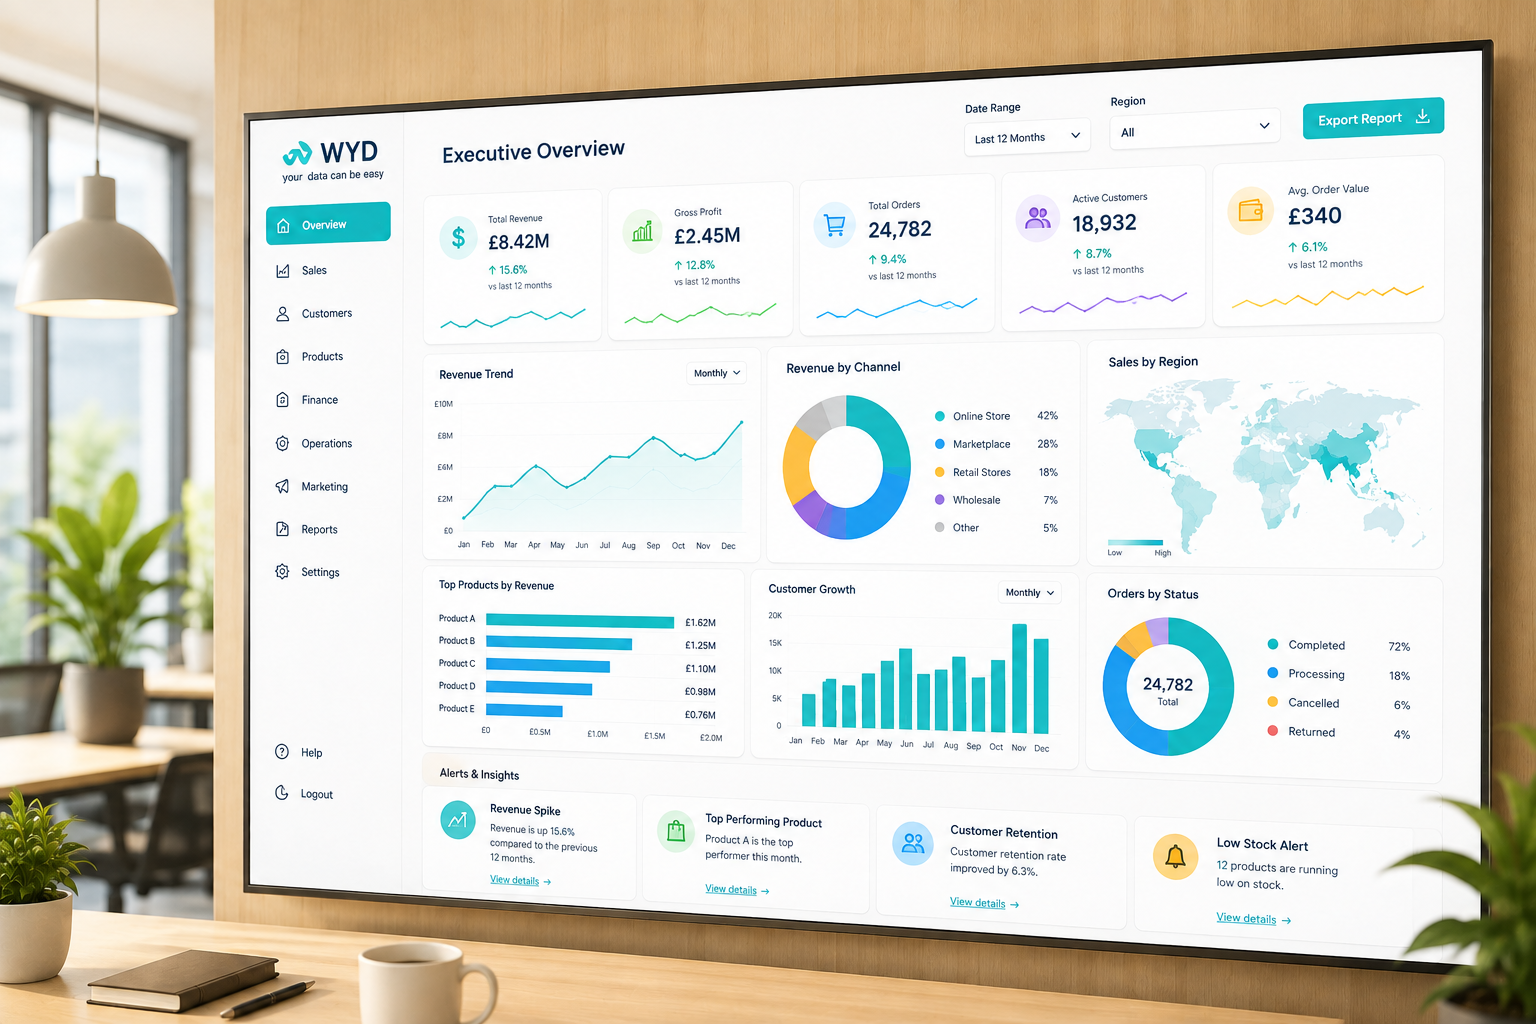
We design and build reporting that works for real people, helping decision-makers find answers quickly, with intuitive dashboards, clear reporting and the guidance they need to make the most of their data.
Typical outcomes:
Executive dashboards that provide both high-level and detailed business insight
KPI reports tailored to departments and business functions
Location-based analytics for geographical decision-making
Self-service reporting for technical & non-technical users
Always up-to-date and accurate information
Business & Finance Analysis
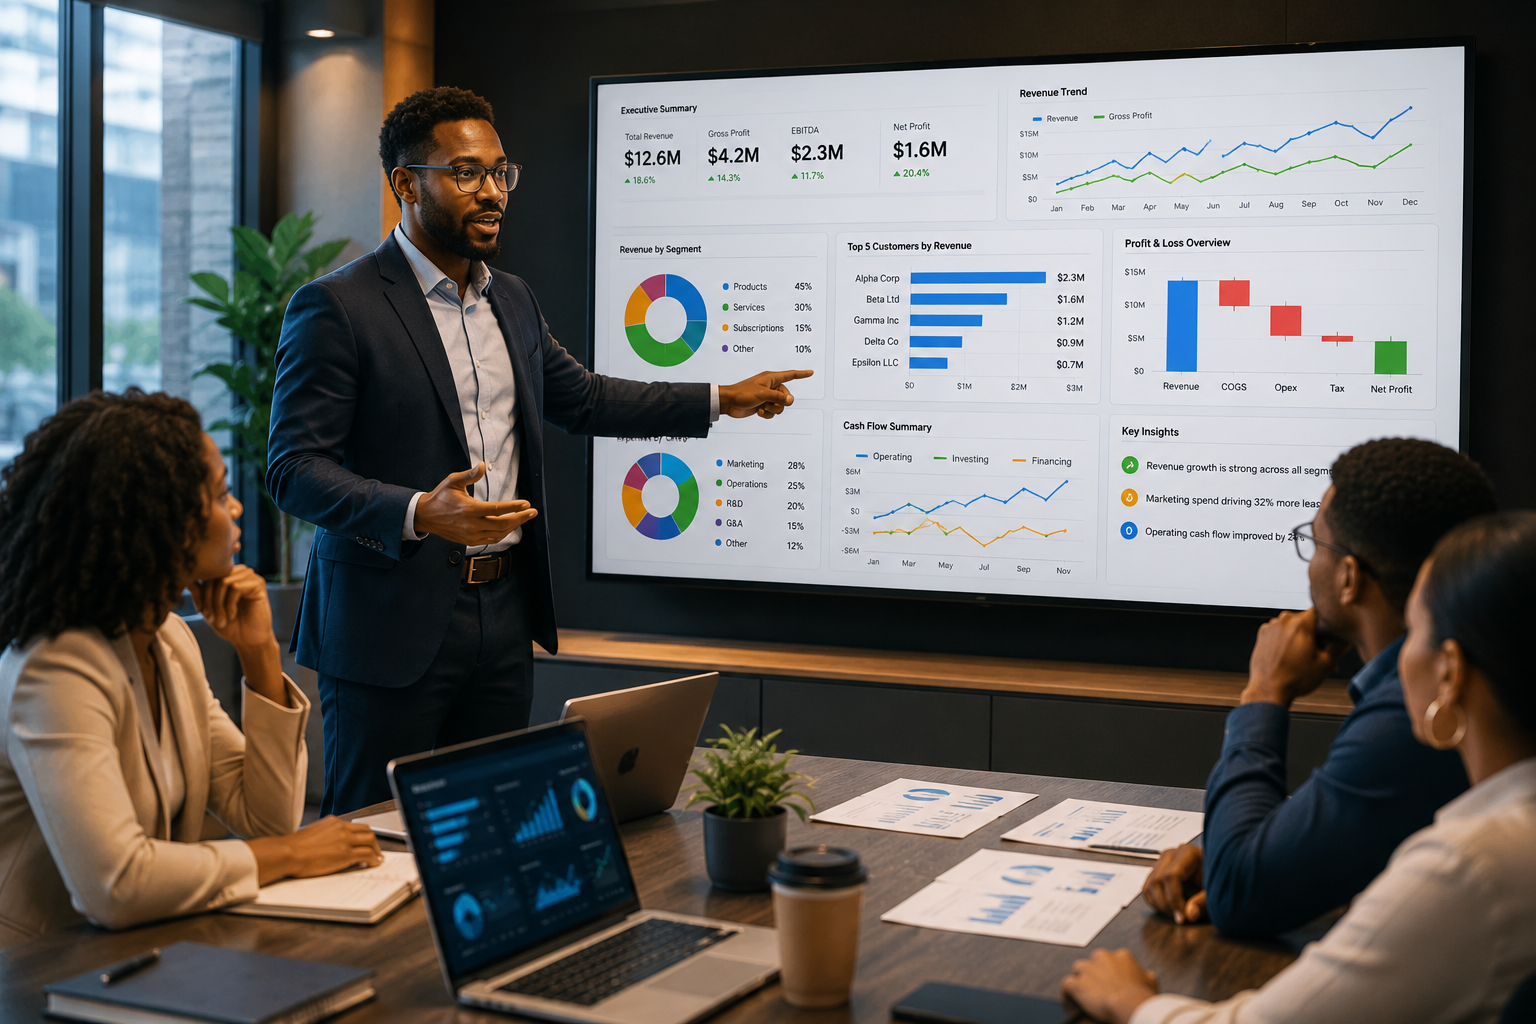
We have financial analysts to help you understand what's happening in your business, why it's happening, and where you have opportunities to improve performance. We also have data analysts who can resolve any data issues, ensure consistent data accuracy and enrich data quality.
Typical outcomes:
Profitability analysis to identify revenue and cost drivers
Sales and marketing performance analysis across channels
Return on investment (ROI) and advertising performance analysis
Data cleansing, reconciliation and quality improvement
Business performance reports that support better decision-making
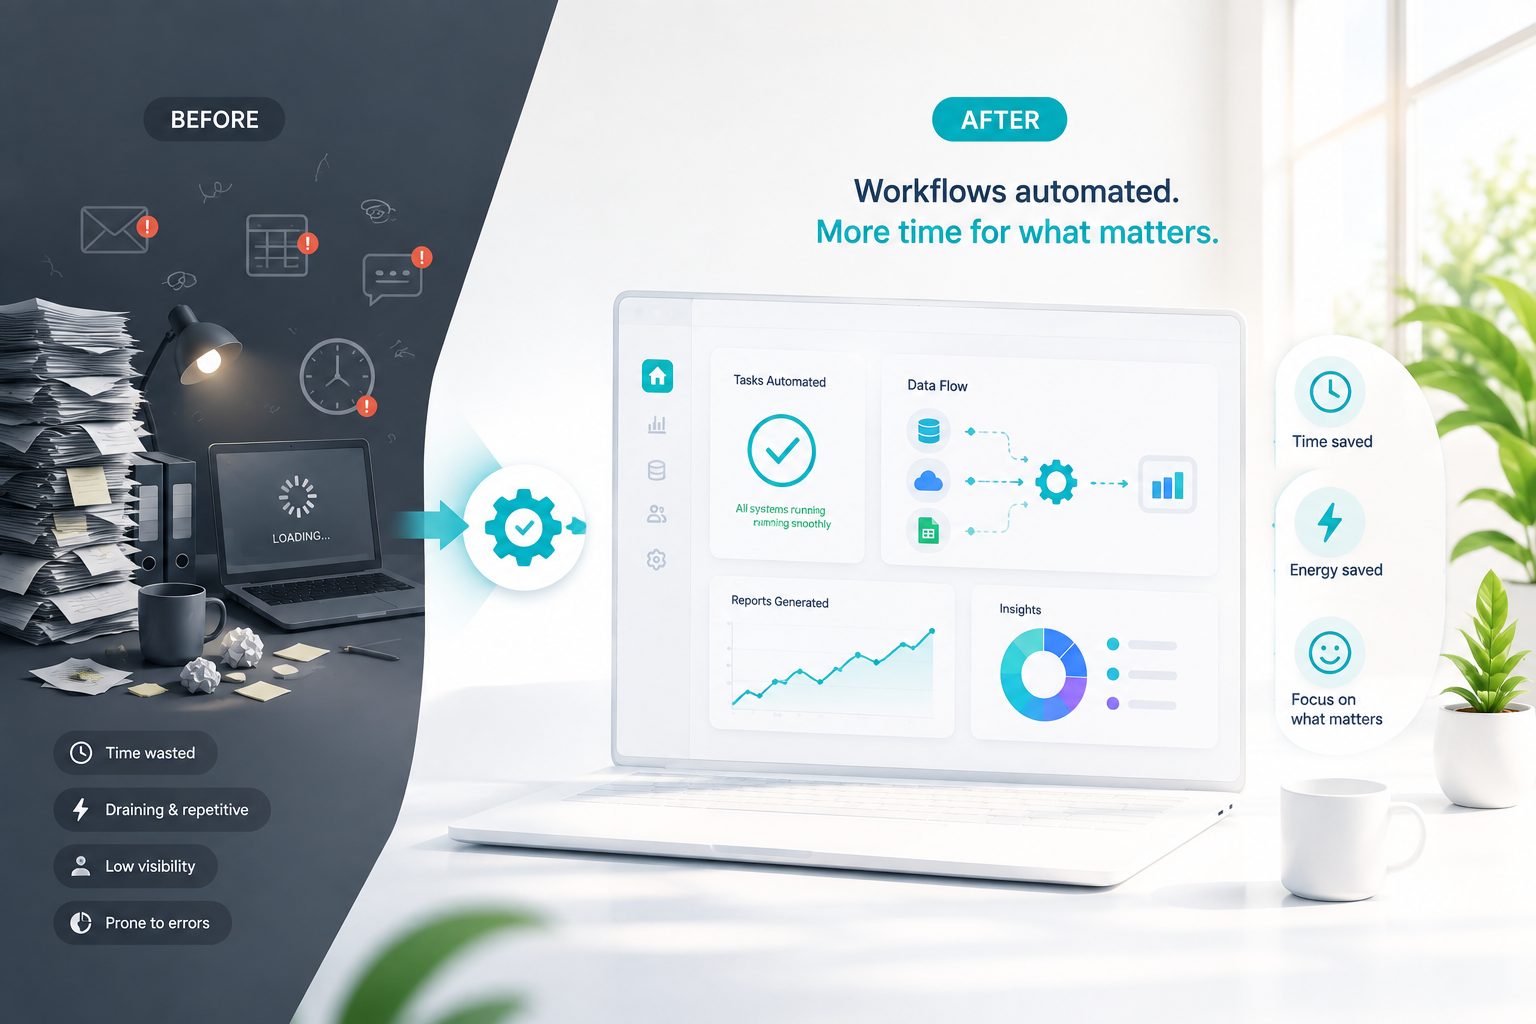
Automating Manual Processes
If your team spends hours repeating manual tasks, that's time taken away from work that creates real value. We automate repetitive business processes so your people can focus on analysis, decision-making and serving your customers… No more CSV downloads!
Typical outcomes:
Automated report preparation and distribution
Automated data collection and processing
Streamlined spreadsheet and Excel-based workflows
Reduced manual effort and fewer processing errors
Faster, more consistent business processes
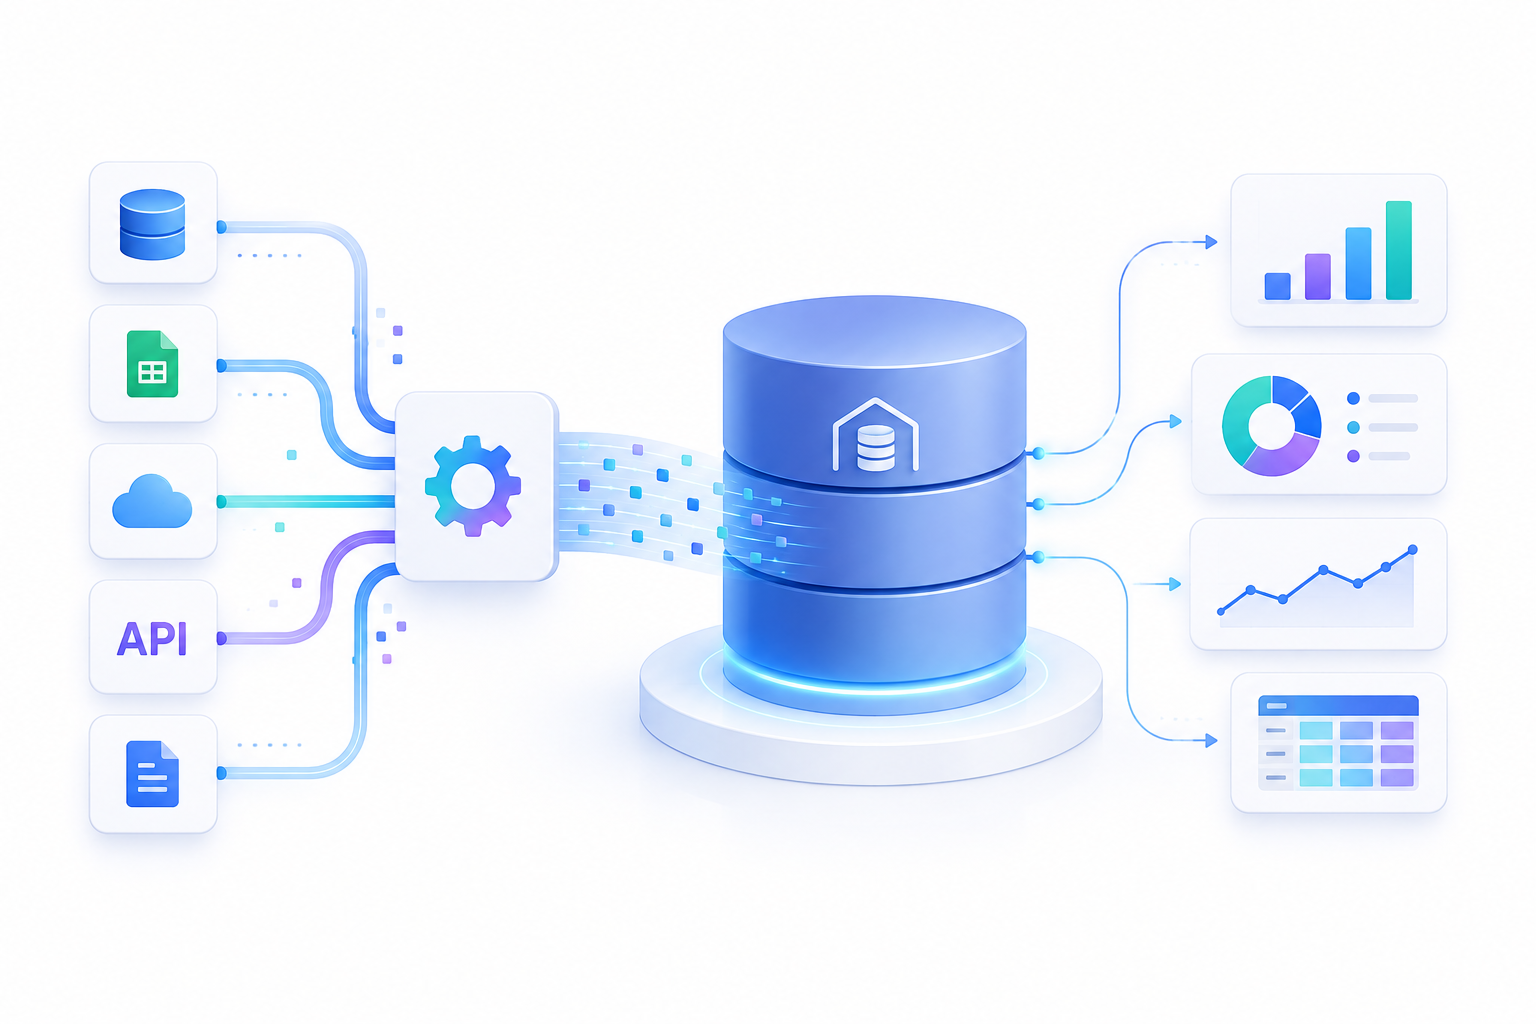
Data Warehouses & ETL
We have expert data architects, data engineers and BI developers across a wide range of technologies. We build data lakes, warehouses and ETL pipelines that can consolidate data from your different systems into a single, golden source. Whatever your technical environment, we can build a solution that will fit seamlessly.
Typical outcomes:
A centralised data warehouse
Automated data integration from multiple systems
Reliable, consistent data across your organisation
Secure access controls for different user groups
A scalable data platform ready for future growth
Embedded Analytics for Apps
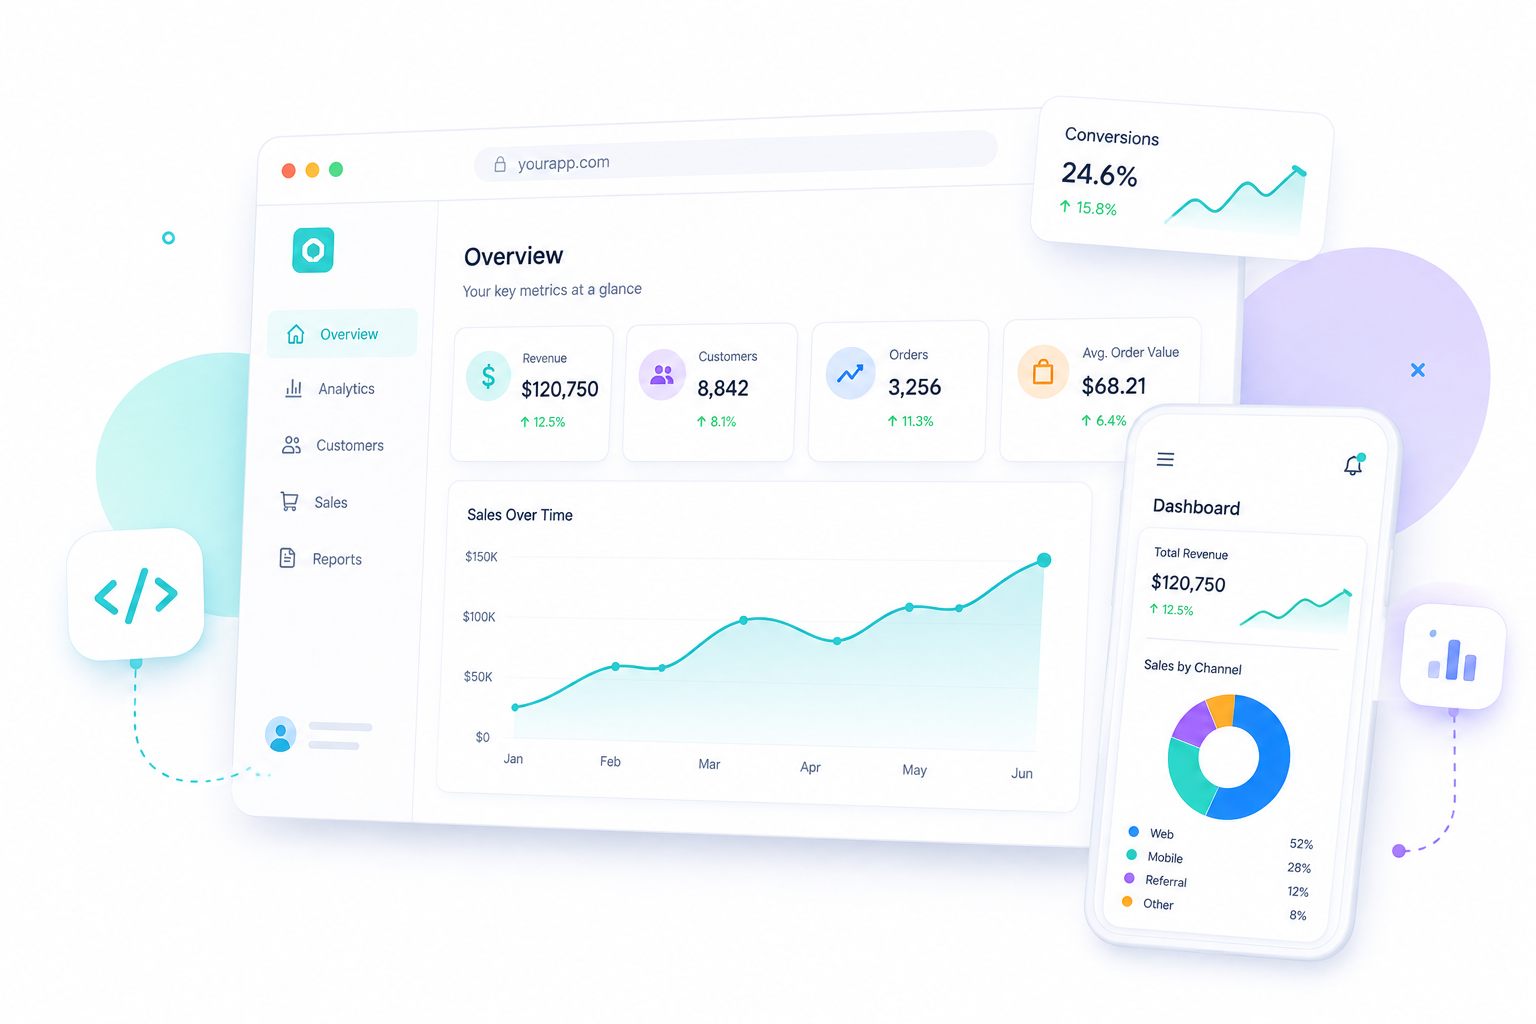
Would you like to get better transparency into your user behaviour? Would you like to give your users more ways to understand how they interact with your app? We build analytics directly into your applications so both you and your users can get better insights without leaving the platform.
Typical outcomes:
Interactive dashboards embedded within your application
Better visibility into customer behaviour and product usage
Usage metrics and business KPIs for administrators
Analytics that improve user engagement and decision-making
A richer, more valuable user experience
Power BI
ARTHUR
Snowflake
Google Big Query
IRIS
Meta Ads
KLAVIYO
Looker Studio
MS Excel
SQL Server
Quickbooks
Google Sheets
Shopify
MS Azure
Deputy
Google Cloud
MS Power Query
MS VBA
Tableau
Python
MS Fabric
Xero
Google Ads
Power BI ARTHUR Snowflake Google Big Query IRIS Meta Ads KLAVIYO Looker Studio MS Excel SQL Server Quickbooks Google Sheets Shopify MS Azure Deputy Google Cloud MS Power Query MS VBA Tableau Python MS Fabric Xero Google Ads
Some Examples…
Enterprise Resource Planning
Finance Dashboards
KPI Reporting

Non-Profit
Consolidated Enterprise Reporting for Social Care and Housing provider
The goal
The client had two main goals.
One was to consolidate data held across different areas of the business, synchronise understanding, increase transparency and remove inconsistencies and data issues across departments
The other was to have access to up-to-date information so that business decisions are not made without out-of-date information.
What we delivered
Consolidated HR, Timesheet, client care, property and finance data into a single warehouse that refreshes daily
Reviewed business logic in different departments, identified gaps, and held workshops with team leaders to align the understanding and implementation of business logic
Created a customised suite of dashboards for each team, giving them easy access to up-to-date verified information for decision-making
Automated manual processes across the company, allowing team members to spend less time preparing reports and more time on value-added analysis and decisions
Excel maintenance interfaces that allowed users to manage manually maintained data and have it fed directly into reporting
Green Energy
Geo - Mapping
Start Up
Renewable Energy GIS Analytics
The problem
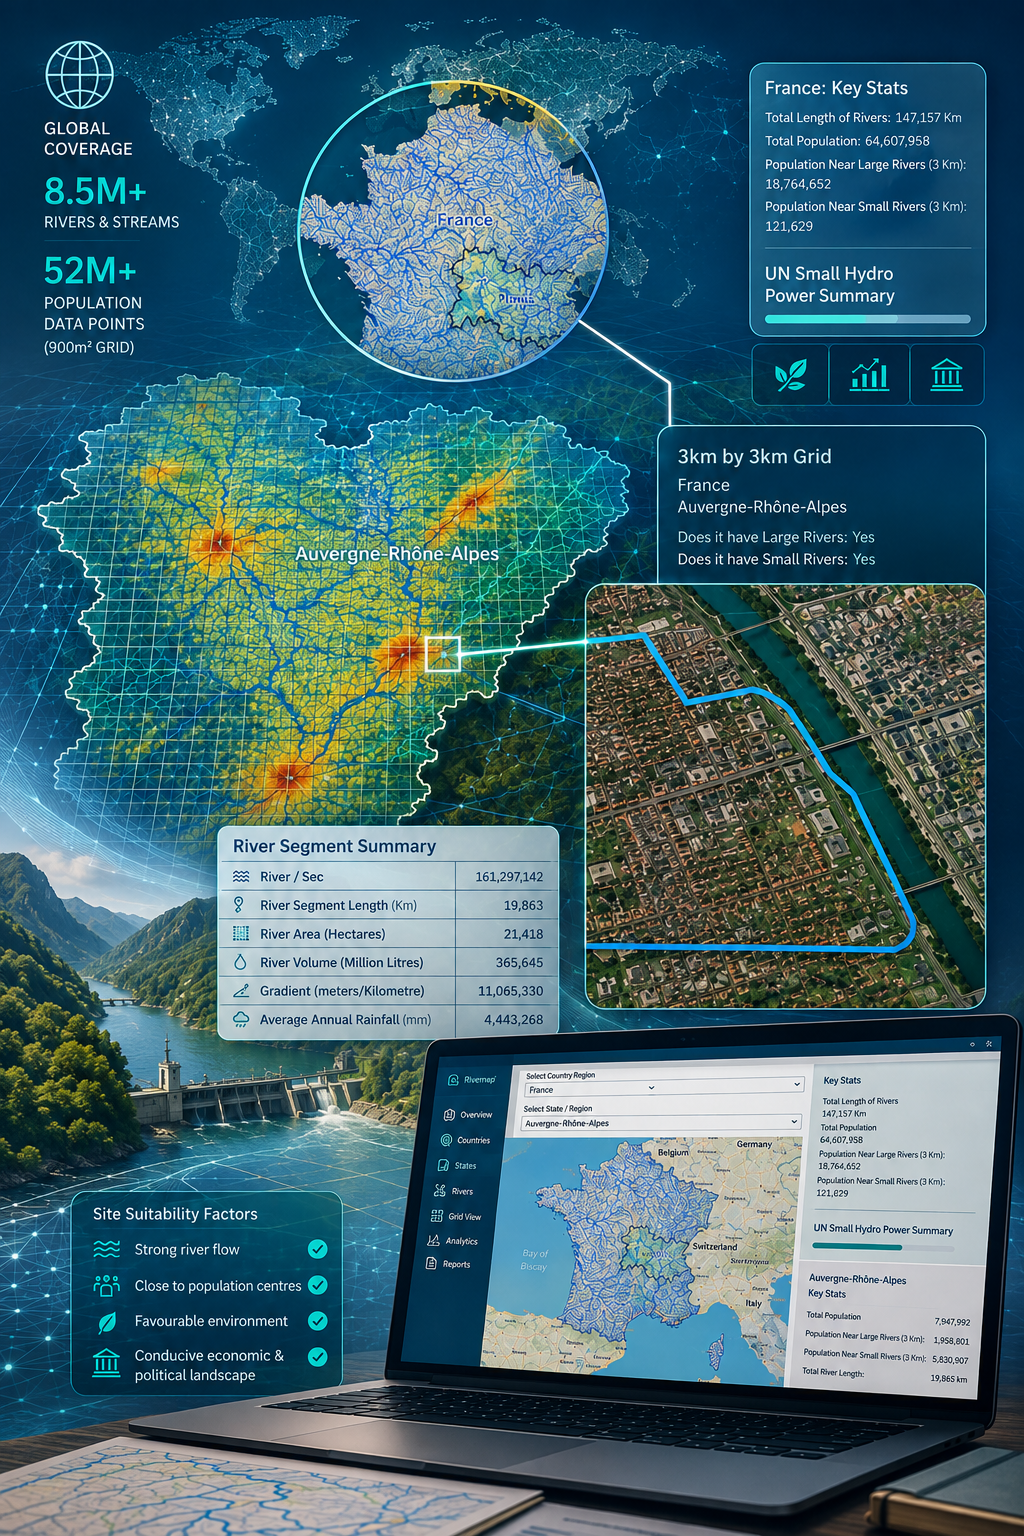
A clean-energy startup needed to identify viable sites for river-based renewable infrastructure across the globe. They wanted to identify sites with suitable rivers and streams, in close proximity to population centres, that would currently benefit from additional clean power generation, in countries with a conducive political and economic environment.
What we delivered
Sourced necessary global data from publicly available sources
Hydrology datasets covering 8.5 million rivers and streams
Population density data covering each 900m sq area (52 million data points) across the globe
UN summary of economic and political green energy environment within each country
National and regional Geometry data
User-friendly dashboard that allowed users to browse through each country, review overall suitability and then zoom in to identify individual areas and specific sites for viability
Staff Satisfaction Survey
Embedded Analytics
SaaS
The goal
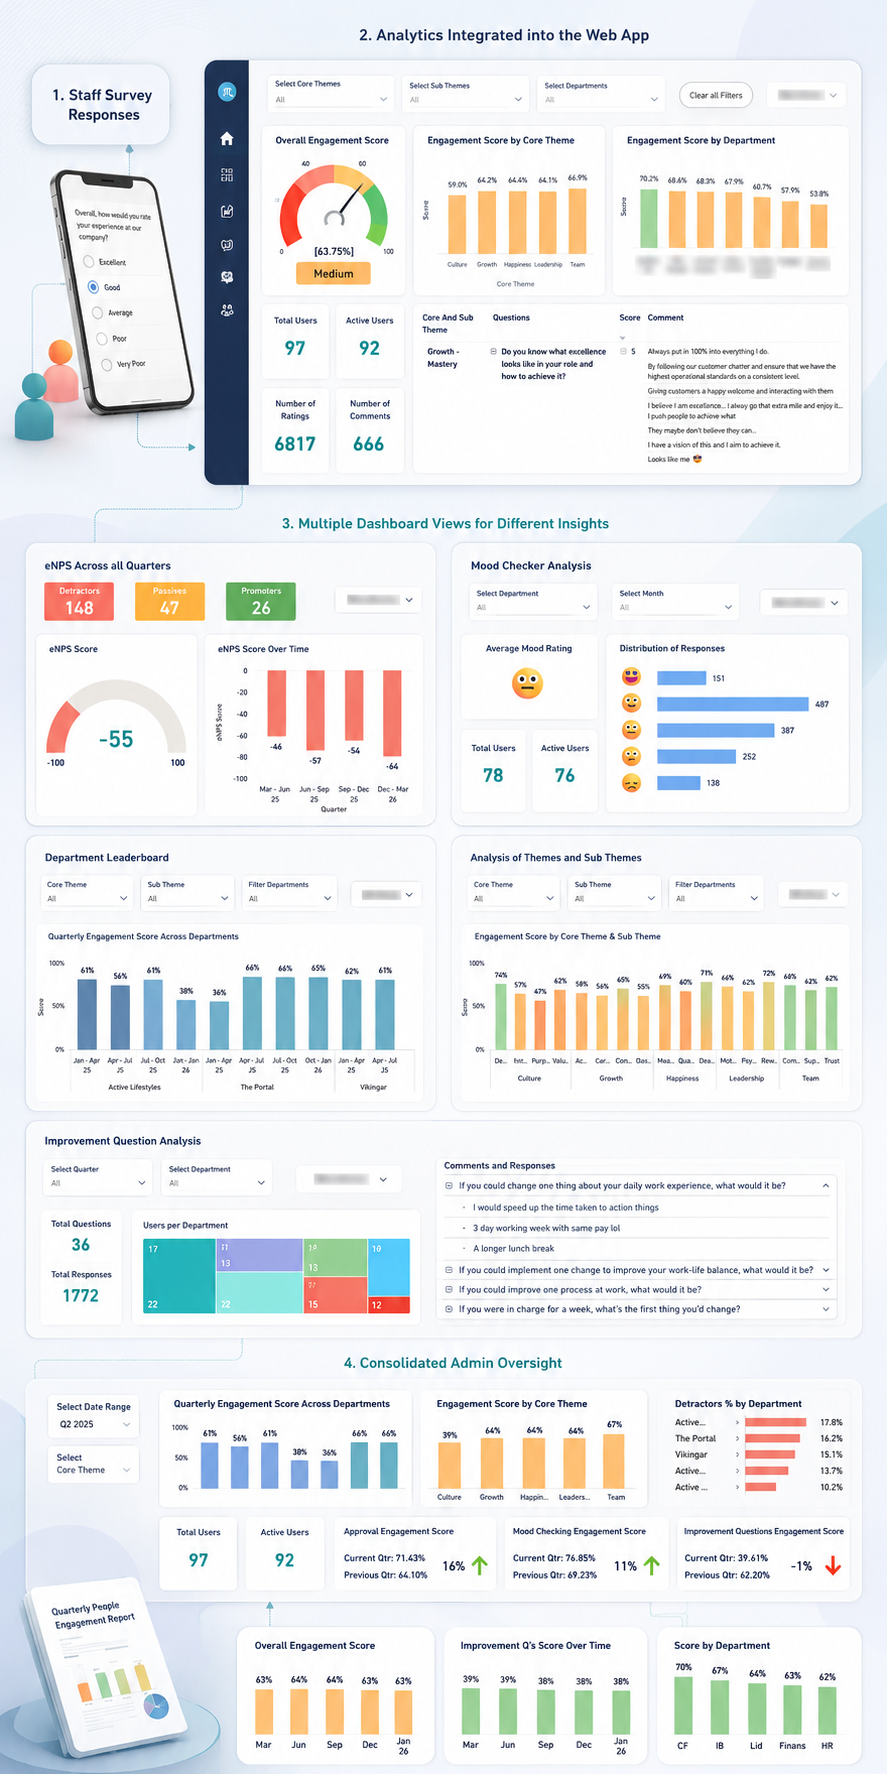
Our client worked with companies to collect and analyse staff satisfaction. They would collect satisfaction survey data through their app and provide quarterly analysis reports based on the results. They decided to add an analytics layer to their web app, which would allow companies to regularly review their own results, as well as significantly speed up the preparation of the quarterly reports.
Integrated Analytics for HR Staff Survey App
What we delivered
Fully integrated analytics feature included in the Web app
Dashboards with an intuitive, easy-to-use interface, so that users of the app can use them without any extra training.
Consolidated Admin dashboard.
Quarterly report template that automatically aggregates, consolidates, and populates charts and data. Allowing the admin user to review and add commentary.
Spreadsheet automation
Invoicing
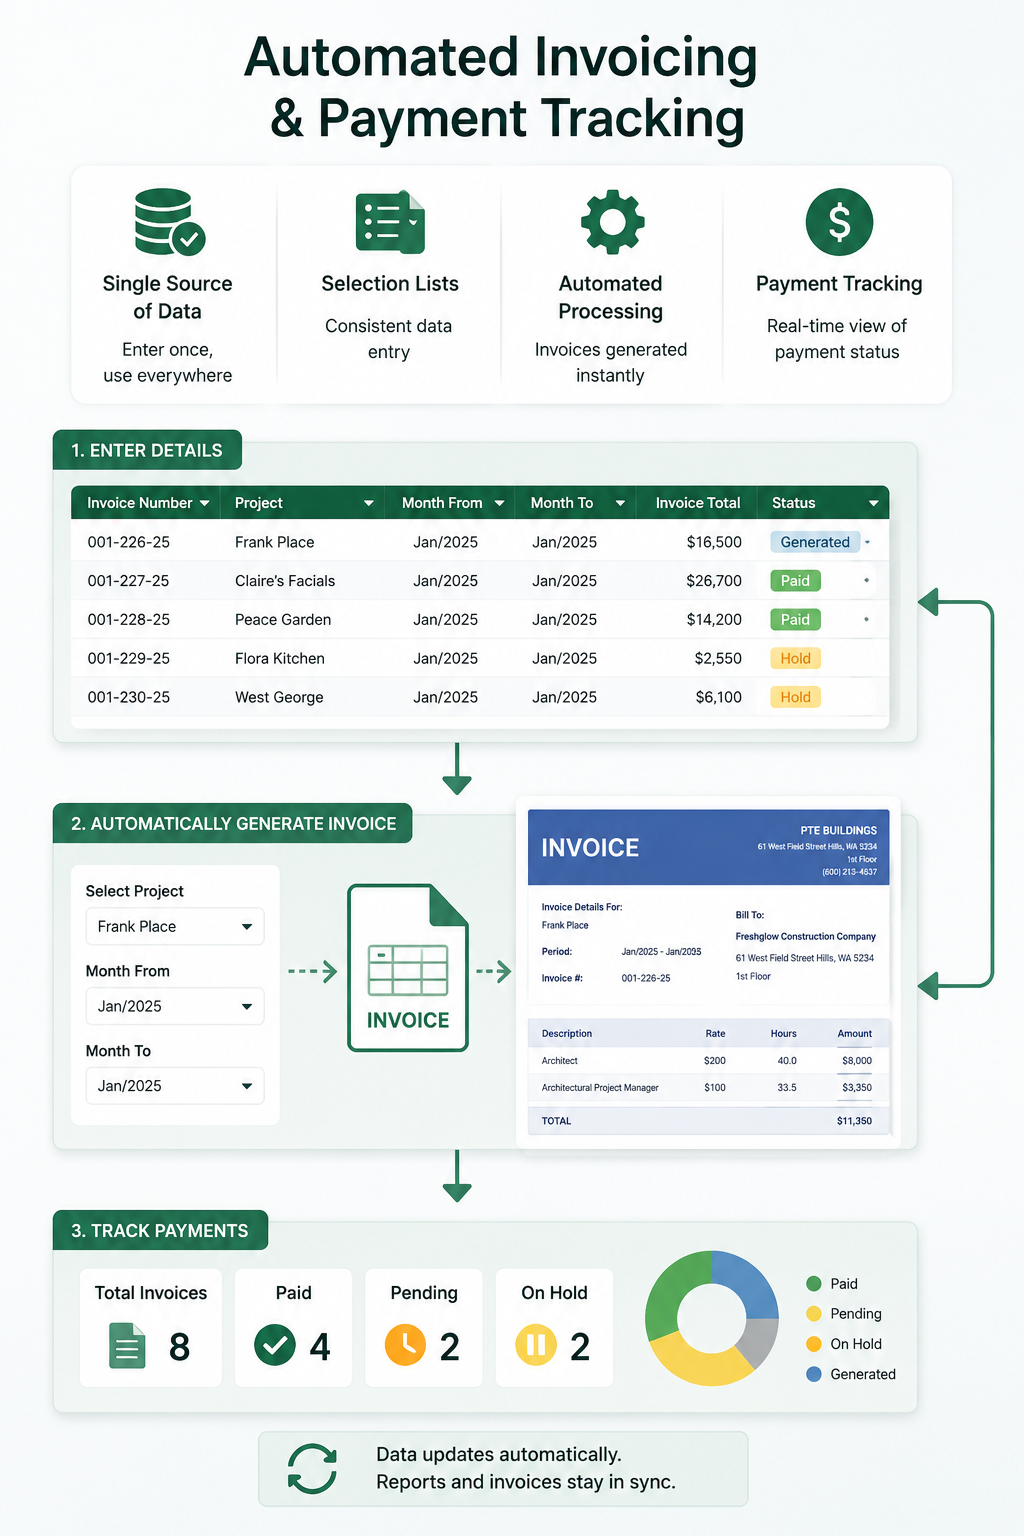
Automating Invoice preparation and payment tracking
The goal
This was a quick project for a small architecture firm that wanted to improve their invoicing process. Their existing process was manual, and as their number of clients grew, it was taking more time and manual errors were beginning to creep in.
What we delivered
A set of automations built into the invoicing spreadsheet
Each piece of data is only entered once and managed in a single place. This makes errors less likely to happen and easy to correct when they do happen.
Selection lists for data entry
Invoices automatically generated. Simply select a client and time period, and an invoice will be created based on contract details and hours booked.
Simplified payment tracking based on auto-generated invoice numbers.
...and many more
Whatever your analytics need we can build a solution that fits you